Imaging of the regional distribution of the tracer in the myocardium makes it possible to visualize ischemia or scarring of the left ventricular myocardium. In addition, by determining the exact location and extent of any myocardial ischemia, it allows an optimal treatment strategy to be found for each patient (e.g. bypass surgery, stent implantation or drug therapy).
In addition to the assessment of myocardial perfusion, PET also allows an absolute quantification of myocardial blood flow (in ml/min/g myocardium), which is associated with a higher diagnostic accuracy compared to SPECT and, in contrast to all other modalities, also allows an assessment of the microcirculation (small vessel disease) (Figure 1). SPECT, on the other hand, only allows a relative assessment of myocardial perfusion and is therefore (like cardiac MRI) dependent on at least one normally perfused coronary supply area. It should also be mentioned that myocardial perfusion PET at our clinic is associated with a very low effective radiation exposure of only approx. 2 millisieverts (mSv), whereas myocardial perfusion SPECT at our clinic leads to a radiation exposure of 5-10 mSv. Due to these advantages, PET is preferred at our clinic for recording myocardial perfusion, while SPECT is recommended primarily for special questions such as assessing the relevance of a coronary anomaly, which requires mandatory bicycle ergometric stress (which is only possible in SPECT).
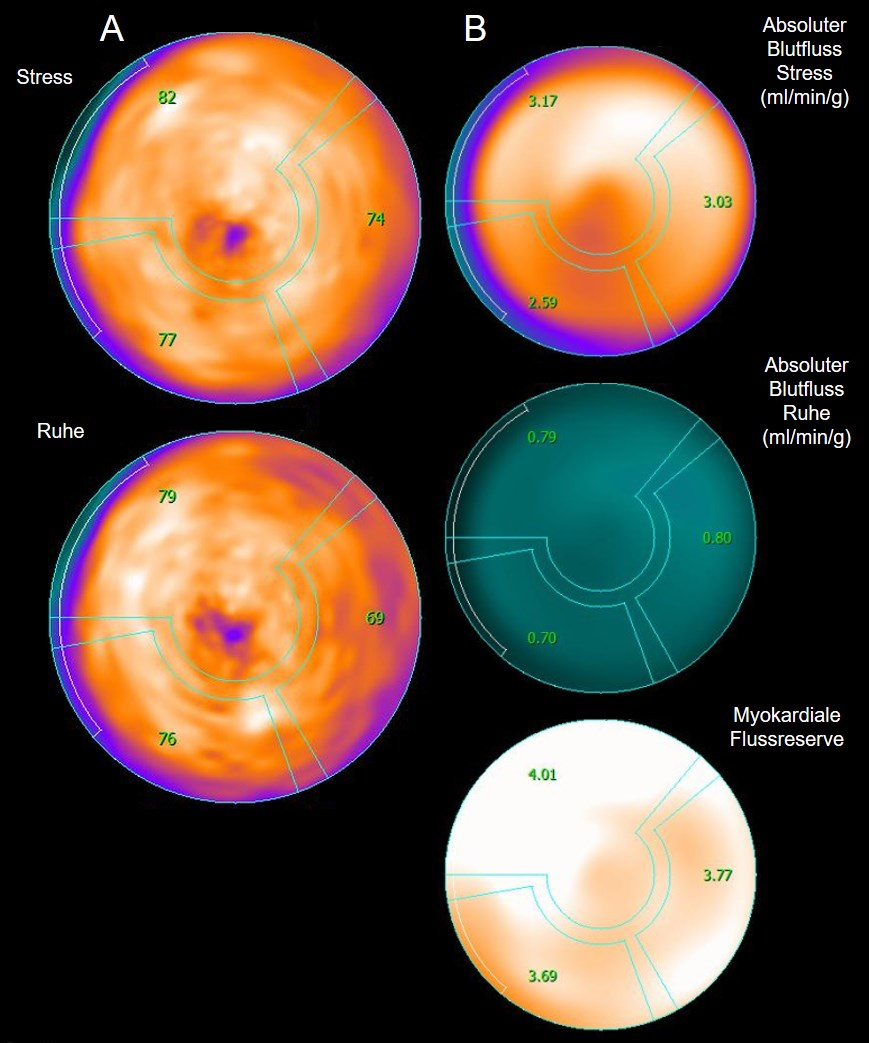
Figure 1: Myocardial perfusion PET shows normal myocardial perfusion (A) under load (top) and at rest (bottom). In addition, the absolute myocardial blood flow (B) under stress (top) and at rest (middle) and the myocardial flow reserve (bottom) can be calculated from this. A myocardial flow reserve of ≥2.5 is considered normal (as in this example).
In contrast to the techniques already described, cardiac CT does not (yet) allow an assessment of myocardial perfusion, but rather provides precise anatomical and morphological information, especially of the coronaries, in which wall changes and stenoses can be excellently visualized (Figure 2). The resolution of the cardiac CT has been continuously improved and the radiation exposure has been continually reduced (to a current average of 0.6 mSv in daily routine operation). The strength of cardiac CT lies above all in its excellent negative predictive value, i.e. a normal finding rules out coronary heart disease with practically 100 % certainty.
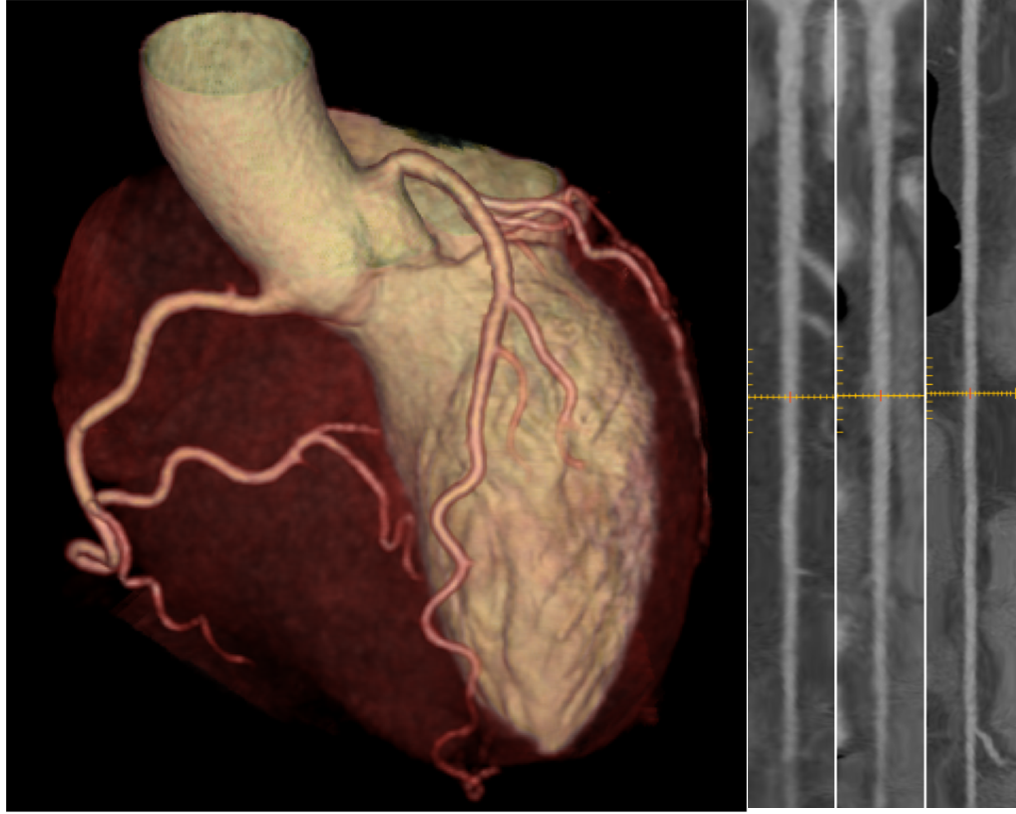
Figure 2: The three-dimensional (so-called volume rendering, left) of the heart allows a good overview of the course of the coronaries and can be used, for example, to exclude coronary anomalies. The coronary arteries themselves (here RIVA, RCX and ACD, right) can be displayed in a stretched form, which allows a clear visualization of wall changes or changes in the coronary arteries. stenoses. In this example, the coronaries are perfectly normal.
Similar to the nuclear medicine modalities, cardiac MR enables the visualization of a circulatory disorder of the heart by means of images at rest and under medical stress, but instead of the radioactive tracer, a very well-tolerated contrast agent containing gadolinium is used. The strength of cardiac MR lies primarily in the detailed visualization of the anatomy of the myocardium and valves as well as the comprehensive assessment of cardiac function. It also allows tissue characterization, such as the visualization of scars.
Each of the above modalities has its specific advantages and disadvantages. Therefore, in many cases a combination of examinations in the sense of a hybrid examination makes sense: The combination of cardiac CT and SPECT or PET allows, for example, the hemodynamic relevance of a stenosis detected in CT to be estimated directly by means of myocardial perfusion SPECT/ or PET and also enables a clear assignment of an ischemic area with a coronary supply area (Figure 3), which in turn allows a very targeted intervention strategy afterwards. Similarly, hybrid cardiac PET/MR allows the combined and simultaneous assessment of morphology and function, e.g. in viability assessment, by using MR to morphologically visualize the extent of myocardial fibrosis, while PET allows viability to be assessed by detecting glucose metabolism.
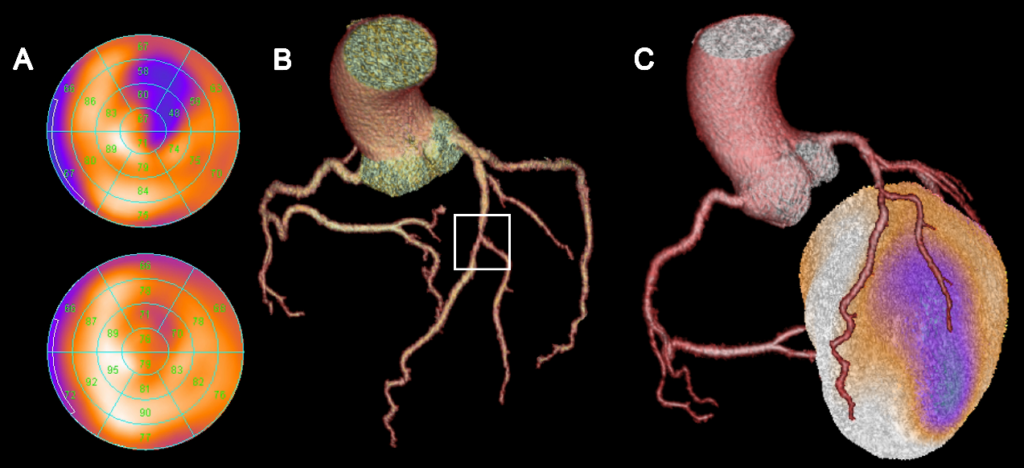
Figure 3: Myocardial perfusion SPECT (A) shows normal perfusion of the myocardium at rest (bottom), but reduced perfusion (blue areas at the top) under stress, which corresponds to anterolateral myocardial ischemia. The heart CT (B) shows a high-grade stenosis in the middle RIVA in the area of the bifurcation to the diagonal branch. Only the merged hybrid display (C) allows a clear assignment of the ischemic area to the diagonal branch. The supply area of the RIVA shows no underperfusion.